My Dashboard > My Dashboard
Role Access: ALL
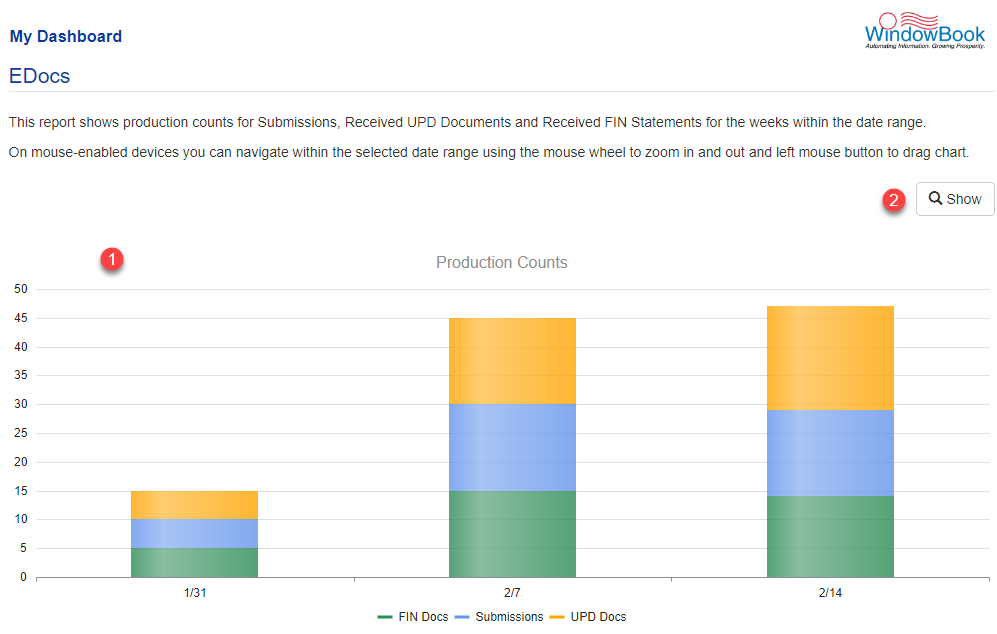
Clicking on My Dashboard shows the My Dashboard page, which has the EDocs production history of submissions (blue), received UPD documents (yellow) and received FIN statements (green) in a graph.

![]() It defaults to the last three weeks, but you can change the filters to change the graph. See below this image for an explanation of filters.
It defaults to the last three weeks, but you can change the filters to change the graph. See below this image for an explanation of filters.

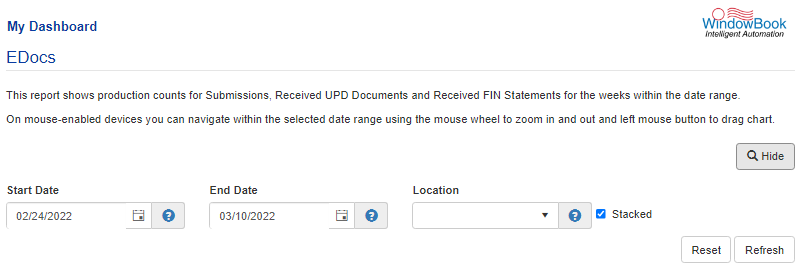
![]() Click Show to see the Filters section. Enter the Start Date and End Date. If you have multiple locations, you can select the Location from the drop-down list. When ready, click Refresh to see a revised graph.
Click Show to see the Filters section. Enter the Start Date and End Date. If you have multiple locations, you can select the Location from the drop-down list. When ready, click Refresh to see a revised graph.
An explanation of each option or field is shown below the print screen:

Start Date: The date shown is the last date of the jobs to be displayed (inclusive). The default date value is 14 days earlier than the current date.
End Date: The last date to be included in the display. The default value is the current date. Must be no more than three weeks from the Start Date. Until it is within this range, the Refresh button will be disabled.

Location: Used to filter by a single location if desired. This filter is required and is always used in combination with the other filters. The ability to select one or multiple locations is predicated on the ‘role’ assigned to the user currently logged in.
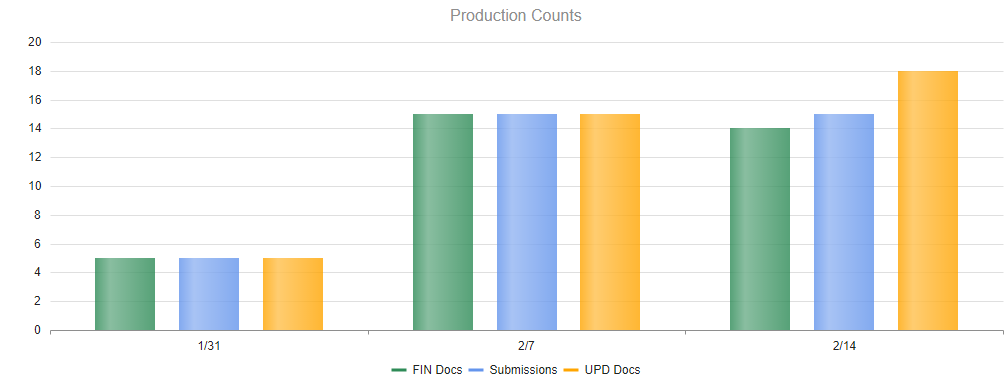
Stacked checkbox: When selected (by default), the statement types (submissions, UPD docs, and FIN Docs) are displayed in a vertically stacked format. If deselected, each type of statement is displayed individually, side-by-side:

In addition, there are three control or function buttons used with the available filters:
Reset: The filter settings will be reset to their default settings when clicked.
Refresh: Used to update the displayed jobs list whenever a filter is changed. The button will turn blue when the displayed data is stale, and the Refresh button needs to be clicked.
Hide: When clicked, the filter settings will become hidden, at which time the label on the button will change to display as Show.
Return to My Dashboard Menu