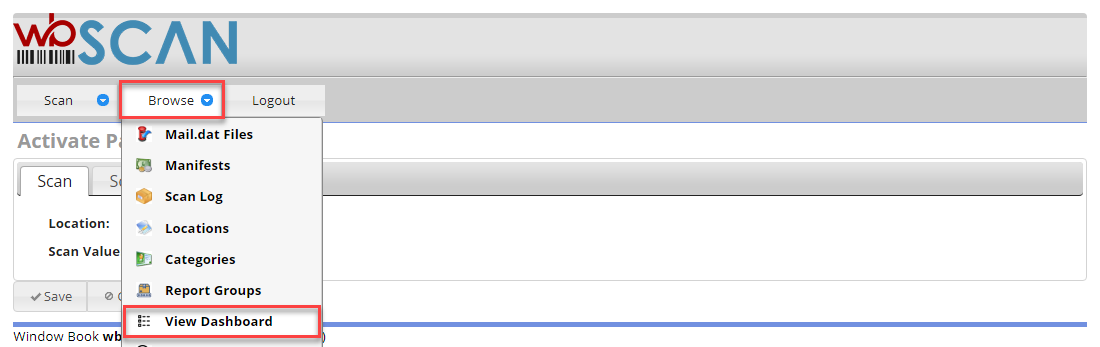
Browse > View Dashboard
wbSCAN’s Dashboard allows Mailers to monitor the production status of their active jobs. The Dashboard is accessible from Browse > View Dashboard.
The Dashboard displays the number of pallets and pieces (and a piece total percentage) for different production functions associated with the scans being made in wbSCAN. It also allows Mailers to define what production functional signals that they are “done” with a job. What data and the amount of data displayed on the Dashboard is defined by the Client in the Dashboard’s Update Settings screen.
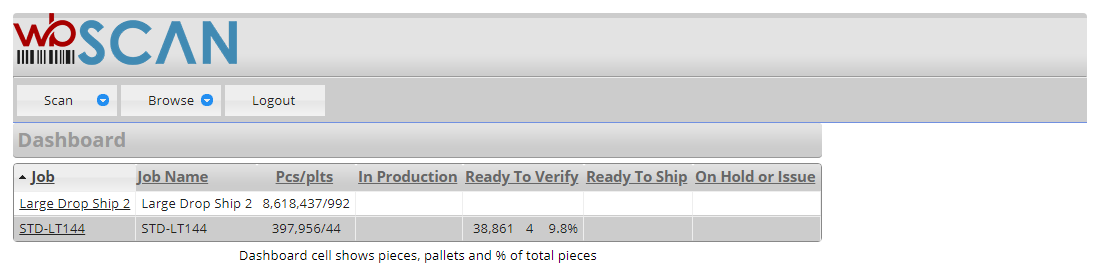
The first three columns that display on the Dashboard are static. They are:
-
Job: This column is populated using the Job Number or Historical Job ID as assigned in DAT-MAIL.
-
Job Name: The name of the job that appears in DAT-MAIL.
-
Pcs/plts: This is the numberr of Pieces and Pallets) associated with the job.
Each of the remaining columns that display (up to eight total) is a Report Group, which is an aggregate of a number of Categories or production functions. Which Report Groups display on the Dashboard are dependent on the Client and what they specify in the Update Settings screen.
Return to Browse Menu List
See also